Benchmarking LLMs: What Metrics Really Matter
This comprehensive guide demystifies LLM benchmarking metrics, explaining which measurements truly matter for practical applications. We cover accuracy metrics like MMLU and HellaSwag, efficiency metrics including tokens-per-second and memory usage, cost considerations, and safety evaluations. Learn how to interpret benchmark scores for your specific use case, balance quality vs. performance trade-offs, and make informed decisions when choosing language models for business applications. Includes practical guidance for non-technical users and decision-makers.

Introduction: Beyond the Leaderboard Numbers
When you look at LLM leaderboards showing models ranked by scores like 85.2% on MMLU or 92.1% on HellaSwag, it's easy to think higher numbers automatically mean better models. But in reality, these benchmark scores tell only part of the story. What matters more is understanding which metrics actually impact your specific use case, and how to balance different performance aspects against cost and practical constraints.
Benchmarking Large Language Models has become increasingly complex as the field evolves. Early benchmarks focused primarily on accuracy and knowledge recall, but modern evaluation must consider dozens of dimensions including reasoning capability, coding proficiency, multilingual performance, safety alignment, and efficiency metrics. According to research from Stanford's Center for Research on Foundation Models, comprehensive LLM evaluation now requires assessing models across at least seven distinct capability categories and multiple safety dimensions1.
Why Standard Benchmarks Can Be Misleading
Before diving into specific metrics, it's crucial to understand the limitations of popular benchmarks. Many widely-used benchmarks suffer from what researchers call "benchmark contamination" - where models have been trained on the exact test data they're being evaluated against, leading to artificially inflated scores. A 2024 study found that approximately 15-25% of improvement on common benchmarks could be attributed to contamination rather than genuine capability improvement2.
Another critical issue is the mismatch between benchmark performance and real-world utility. A model might score exceptionally high on academic question-answering tasks but perform poorly when handling ambiguous customer service queries or generating consistent brand-aligned content. This disconnect occurs because benchmarks are designed to be standardized and reproducible, while real-world applications are messy, contextual, and often domain-specific.
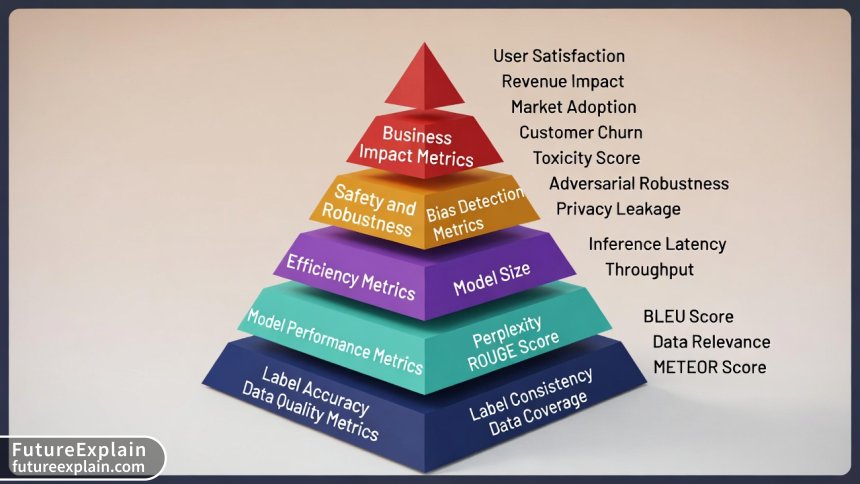
The Three Categories of LLM Metrics
Effective LLM evaluation requires looking at three broad categories of metrics:
- Capability Metrics: How well the model performs tasks
- Efficiency Metrics: How efficiently it uses resources
- Safety & Alignment Metrics: How safely and appropriately it behaves
Capability Metrics: Measuring What Models Can Do
Knowledge and Reasoning Benchmarks
MMLU (Massive Multitask Language Understanding): This benchmark tests models on 57 subjects across STEM, humanities, social sciences, and more. It's become a standard for measuring broad knowledge. However, it's important to note that MMLU primarily tests recall of factual knowledge rather than reasoning ability. A model scoring 85%+ on MMLU has strong general knowledge but may still struggle with complex reasoning chains.
GPQA (Graduate-Level Google-Proof Q&A): A more recent benchmark designed to be "Google-proof" - questions that can't be easily answered by web search. This tests deeper understanding rather than simple fact recall. Models typically score much lower on GPQA than MMLU, which better reflects the gap between memorization and true comprehension.
HellaSwag and WinoGrande: These benchmarks test commonsense reasoning and natural language inference. HellaSwag presents sentence completion tasks requiring understanding of everyday situations, while WinoGrande tests pronoun resolution and contextual understanding. These are particularly important for applications involving dialogue or content that requires understanding implicit context.
Coding and Technical Benchmarks
For development-related applications, coding benchmarks are essential:
- HumanEval: Tests code generation from docstrings (Python-focused)
- MBPP (Mostly Basic Python Problems): Simple programming tasks
- CodeContests: Competitive programming problems
- DS-1000: Data science coding tasks
The key insight here is that different coding benchmarks test different aspects of programming ability. HumanEval tests whether models can implement functions from specifications, while CodeContests tests algorithmic problem-solving. For business applications, you might care more about code correctness and security than solving complex algorithms.
Specialized Domain Benchmarks
Increasingly, specialized benchmarks are emerging for specific domains:
- MedQA and MedMCQA for medical knowledge
- LegalBench for legal reasoning
- FinQA and ConvFinQA for financial reasoning
- Math datasets (GSM8K, MATH, TheoremQA) for mathematical reasoning
If your application targets a specific domain, these specialized benchmarks provide more relevant signals than general knowledge tests. However, they often require domain expertise to interpret correctly.
Efficiency Metrics: The Often-Overlooked Practical Considerations
While capability metrics grab headlines, efficiency metrics often determine whether a model is practical for real-world deployment.
Inference Speed and Throughput
Tokens per second (TPS): Measures how quickly a model generates output. This varies dramatically based on hardware, model size, and optimization. For real-time applications like chatbots, TPS directly impacts user experience. Industry standards suggest: - >50 TPS: Excellent for real-time applications - 20-50 TPS: Acceptable for most applications - <20 TPS: May cause noticeable lag in conversations
First token latency: The time between sending a request and receiving the first token. This is critical for perceived responsiveness, especially in interactive applications.
Throughput under concurrent loads: How performance degrades with multiple simultaneous users. Many models show excellent single-user performance but struggle with concurrency.
Memory and Hardware Requirements
Model size (parameters): While not a direct performance metric, parameter count correlates with hardware requirements and cost. The trend toward smaller, more efficient models (like Microsoft's Phi series or Google's Gemma) reflects the industry's focus on efficiency.
VRAM requirements: How much GPU memory is needed for inference. This directly impacts deployment costs: - 7B parameter models: ~14GB VRAM (FP16) - 13B parameter models: ~26GB VRAM (FP16) - 70B parameter models: ~140GB VRAM (FP16)
Quantization impact: Many models can be quantized (reduced precision) to save memory with minimal quality loss. Understanding different quantization approaches (GPTQ, AWQ, GGUF) and their quality/efficiency trade-offs is essential for practical deployment.
Cost-Per-Token Analysis
Perhaps the most important business metric is cost per token, which combines inference costs with cloud hosting or hardware expenses. A model might be 5% more accurate but cost 10x more to run, making it economically impractical for many applications.
Cost considerations include: - API pricing (if using cloud services) - Cloud instance costs (if self-hosting) - Electricity consumption - Cooling requirements - Maintenance overhead
According to analysis from AI infrastructure companies, for many business applications, a 70B parameter model needs to be at least 15-20% more accurate than a 7B model to justify the 10x higher operational costs3.
Safety and Alignment Metrics: Beyond Technical Performance
As LLMs move into production, safety and alignment metrics become increasingly critical. These measure whether models behave appropriately and avoid harmful outputs.
Toxicity and Bias Detection
RealToxicityPrompts: Tests propensity to generate toxic content when given edge-case prompts.
BOLD (Bias in Open-ended Language Generation Dataset): Measures demographic biases in generated text across five domains and four demographic groups.
StereoSet: Evaluates stereotypical bias in model completions.
What's important to understand is that different models make different trade-offs between safety and helpfulness. Overly aggressive safety filters can make models refuse to answer legitimate questions (the "refusal problem"), while insufficient filtering risks harmful outputs.
Jailbreak Resistance
With the rise of adversarial prompting techniques, measuring jailbreak resistance has become crucial. Benchmarks like JailbreakBench and HarmBench systematically test how easily safety guardrails can be circumvented.
Recent research shows that many models that perform well on standard safety benchmarks remain vulnerable to sophisticated jailbreak attacks, with some studies finding success rates over 50% for certain attack methods4.
Truthfulness and Hallucination Metrics
TruthfulQA: Measures tendency to reproduce falsehoods commonly found online.
FACTOR (Factual Accuracy via Token-level Objective Rating): A newer approach that evaluates factuality at the token level rather than sentence level.
Self-checking capabilities: Some evaluation frameworks test whether models can recognize and correct their own mistakes, which is crucial for applications requiring high accuracy.
Practical Evaluation Strategies for Business Applications
Creating Your Own Evaluation Suite
For business applications, creating domain-specific evaluation sets is often more valuable than relying solely on public benchmarks. Here's a practical approach:
- Identify critical use cases: What specific tasks will the model perform?
- Create representative test cases: 50-100 examples covering edge cases and common scenarios
- Define success criteria: What constitutes acceptable vs. excellent performance?
- Establish baselines: Compare against existing solutions or human performance
- Test iteratively: Regular evaluation as models and requirements evolve
Human Evaluation vs. Automated Metrics
While automated metrics provide scalability, human evaluation remains essential for assessing quality dimensions that are difficult to quantify automatically:
- Coherence and flow: Does the output read naturally?
- Tone and brand alignment: Does it match organizational voice?
- Practical utility: Does it actually help solve the problem?
- Creativity and insight: Does it provide novel perspectives?
The most effective evaluation strategies combine automated metrics (for scalability and consistency) with targeted human evaluation (for nuanced quality assessment).
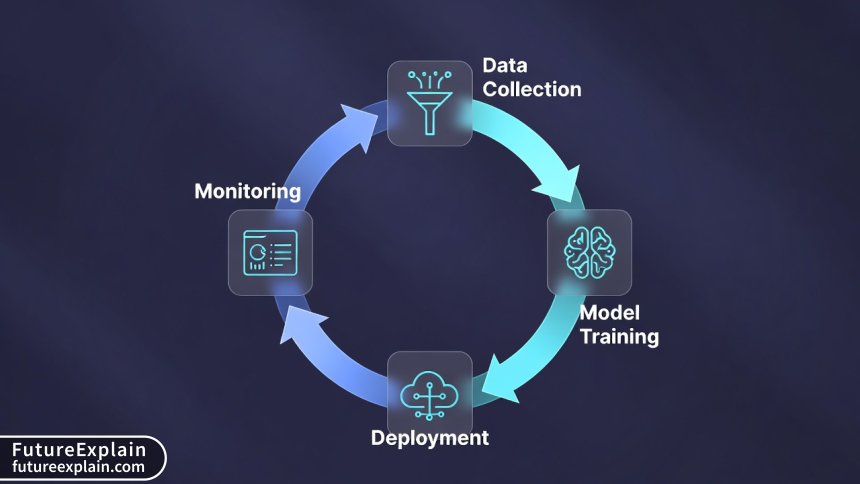
Monitoring Production Performance
Evaluation shouldn't end at deployment. Continuous monitoring is essential because:
- User behavior may differ from test scenarios
- Model performance can drift over time
- New edge cases emerge in production
- Cost patterns may change with usage scales
Key production metrics to monitor include: - User satisfaction scores (explicit and implicit) - Task completion rates - Error rates and types - Cost per successful task - Latency percentiles (P50, P90, P99)
Interpreting Benchmark Results: A Practical Guide
Understanding Statistical Significance
Small differences in benchmark scores (e.g., 82.1% vs. 82.4%) are often not statistically significant. When comparing models, consider:
- Confidence intervals: Most benchmarks report scores with margins of error
- Effect size: Is the difference large enough to matter practically?
- Consistency across tasks: Does one model consistently outperform, or is it task-dependent?
As a rule of thumb, differences less than 1-2 percentage points on most benchmarks are unlikely to translate to noticeable differences in production, unless your application is extremely sensitive to small accuracy improvements.
The Diminishing Returns Curve
In LLM performance, there's typically a curve of diminishing returns. Moving from 70% to 80% accuracy might be relatively easy and cost-effective, while moving from 90% to 95% might require exponentially more resources. Understanding where your application falls on this curve helps make rational trade-off decisions.
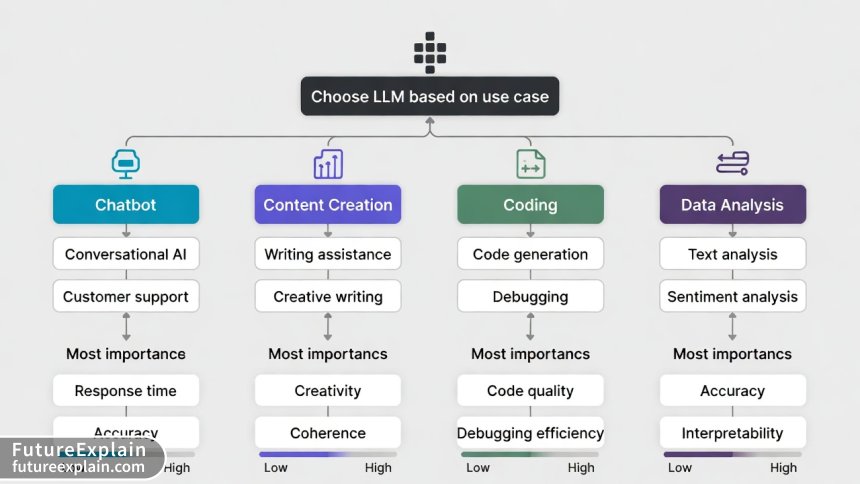
Task-Specific vs. General Capability
Some models excel at specific tasks while others provide more balanced capability. For specialized applications, a model with exceptional performance on your specific task type (even if mediocre on others) might be preferable to a generally capable model.
Emerging Trends in LLM Evaluation
Multimodal Evaluation
As models become multimodal (processing text, images, audio), evaluation frameworks are expanding beyond text-only metrics. New benchmarks like MMMU (Massive Multi-discipline Multimodal Understanding) and SEED-Bench assess cross-modal understanding capabilities.
Reasoning and Planning Evaluation
Traditional benchmarks often test pattern recognition rather than true reasoning. New evaluation approaches focus on: - Chain-of-thought verification: Checking if reasoning steps are logically sound - Planning tasks: Testing ability to break down complex problems - Causal reasoning: Understanding cause-effect relationships
Real-World Task Evaluation
There's growing recognition that synthetic benchmarks don't fully capture real-world performance. Initiatives like SWE-bench (testing ability to fix real GitHub issues) and LiveCodeBench (continuous evaluation on current coding problems) aim to provide more realistic assessment.
Putting It All Together: A Decision Framework
When evaluating LLMs for your application, consider this structured approach:
- Define must-have vs. nice-to-have requirements: What capabilities are essential vs. desirable?
- Establish performance thresholds: What minimum scores are acceptable?
- Consider total cost of ownership: Include all deployment and operational costs
- Evaluate trade-offs systematically: Use weighted scoring based on importance
- Test with your data: No benchmark substitutes for testing with your actual use cases
- Plan for evolution: Consider how requirements might change over time
Conclusion: Metrics as Guides, Not Answers
Benchmark metrics provide valuable signals about LLM capabilities, but they should inform rather than dictate decisions. The most effective approach combines quantitative benchmark data with qualitative assessment of how models perform on your specific tasks, in your specific context.
Remember that the LLM landscape evolves rapidly. Today's top-performing model on standard benchmarks might be surpassed next month, and metrics that matter today might become less relevant as the field advances. The most valuable skill isn't memorizing current benchmark scores, but understanding how to interpret and apply evaluation methodologies to make informed decisions that align with your specific needs and constraints.
By focusing on the metrics that actually matter for your application, balancing capability with efficiency, and maintaining a holistic view of model performance, you can make better decisions about which LLMs to deploy and how to get the most value from them.
Visuals Produced by AI
Further Reading
Share
What's Your Reaction?
 Like
1543
Like
1543
 Dislike
12
Dislike
12
 Love
423
Love
423
 Funny
45
Funny
45
 Angry
8
Angry
8
 Sad
5
Sad
5
 Wow
287
Wow
287


The discussion about multilingual benchmarks earlier was helpful. Does anyone have experience with evaluating Japanese language performance specifically? Most benchmarks are English-centric.
Akira, we've been testing Japanese performance. Look for JGLUE (Japanese General Language Understanding Evaluation) and Japanese versions of common benchmarks. Also consider culture-specific aspects like honorifics and context that don't translate directly from English benchmarks.
As a non-technical manager, this article helped me understand what questions to ask our AI team. Instead of just "which model is best," I can now ask about specific metrics relevant to our business goals.
The statistics around jailbreak success rates (over 50% for some attacks) is alarming. Are there any models that perform significantly better on jailbreak resistance? We're in a regulated industry and can't afford safety failures.
Igor, models with constitutional AI approaches (like Anthropic's Claude) tend to have stronger jailbreak resistance, but nothing is perfect. Defense in depth is key: input filtering, output monitoring, and human oversight for sensitive applications. Also consider ensemble approaches where multiple models check each other.
The article mentions "task-specific vs general capability" but I'd love more examples. When does it make sense to use a specialized model vs a general one? We're doing both content generation and data analysis.
Lucinda, we faced this decision. We ended up using a general model for content generation (needs broad knowledge) and a specialized code model for data analysis (needs precise execution). The cost of maintaining two models was worth the performance improvement on each task.
I work in education technology. Are there specific benchmarks for evaluating LLMs as tutoring assistants? We need to assess pedagogical effectiveness, not just factual accuracy.
Elena, great question! For educational applications, consider: 1) Pedagogical correctness (not just factual), 2) Ability to scaffold explanations, 3) Adapting to different learning styles, 4) Avoiding harmful stereotypes in examples. There's emerging work on "AI Tutor" evaluation, but most teams create custom assessments based on learning science principles.
The decision framework at the end is practical and actionable. We've been using a similar approach internally but having it documented with examples helps communicate the process to stakeholders.