Explainability Tools: XAI for Non-Experts
This comprehensive guide introduces Explainable AI (XAI) to non-technical readers, covering why AI explainability matters for business, ethics, and compliance. We demystify complex concepts like SHAP, LIME, and counterfactual explanations using simple analogies. The article provides practical comparisons of 12+ XAI tools categorized by user skill level, with special focus on no-code platforms. You'll learn step-by-step how to interpret common XAI visualizations, implement explainability in real business scenarios, and create actionable XAI reports for stakeholders. Includes downloadable templates, real case studies, and a decision framework for choosing the right XAI tools for your needs.

Why Black Box AI Is No Longer Acceptable
Imagine asking a financial advisor for investment recommendations and receiving this response: "Trust me, this stock will perform well, but I can't explain why." You'd probably look for a new advisor. Yet for years, this is exactly how many artificial intelligence systems have operated—making important decisions without providing understandable explanations.
Explainable AI (XAI) represents a fundamental shift toward transparency in artificial intelligence. It's the collection of tools, techniques, and frameworks that help humans understand how AI systems arrive at their decisions. While this might sound technical, the core concept is simple: if AI is making decisions that affect people's lives, jobs, or finances, we deserve to know why.
In this guide, we'll demystify XAI for non-technical readers. You'll learn what explainable AI really means, why it's becoming essential for businesses, and most importantly, how you can use XAI tools—even without coding skills—to understand, trust, and improve the AI systems you encounter or implement.
What Is Explainable AI (XAI)? Simple Analogies
Let's start with three simple analogies that make XAI concepts accessible:
- The Restaurant Recipe Analogy: Traditional "black box" AI is like eating at a restaurant where the chef refuses to share recipes. XAI is like a cooking show where every ingredient and step is explained. You might not become a chef, but you understand how the dish was made.
- The Medical Diagnosis Analogy: A doctor who simply says "you have condition X, take this pill" versus one who explains symptoms, test results, and why this treatment was chosen. Both might reach the same conclusion, but the second builds trust and enables informed decisions.
- The Car Mechanic Analogy: A mechanic who says "your car needs a new transmission, $3,000" versus one who shows you the worn parts, explains how they connect to your symptoms, and demonstrates why replacement is necessary.
At its core, XAI provides the "why" behind AI decisions. This transparency serves multiple crucial purposes:
- Building Trust: Users are more likely to trust and adopt AI systems they understand
- Identifying Bias: Explanations can reveal unintended biases in AI models
- Meeting Regulations: Growing legal requirements demand AI explainability
- Improving Models: Understanding failures helps developers create better AI
- Enabling Human Oversight: Experts can intervene when explanations reveal problems
The Real-World Consequences of Unexplainable AI
Before we dive into solutions, let's examine why XAI matters through real cases where lack of explainability caused problems:
- Healthcare Misdiagnosis: An AI system recommended against cancer treatment for certain patients, but doctors couldn't understand why. Later analysis revealed the model was improperly weighing non-medical factors like income level.
- Loan Application Rejections: Banks using AI for loan approvals faced lawsuits when applicants couldn't receive explanations for rejections. Regulators now demand explainable decisions in financial services.
- HR Screening Failures: Resume screening AI that disproportionately rejected female candidates couldn't explain its bias until XAI tools revealed it was penalizing words associated with women's organizations.
- Autonomous Vehicle Accidents: Self-driving cars making unexplained decisions erode public trust and complicate liability determinations after incidents.
These examples illustrate why XAI has moved from academic interest to business necessity. According to recent industry surveys, 78% of businesses cite "lack of explainability" as a primary barrier to AI adoption, and 65% have delayed or cancelled AI projects due to transparency concerns.
Core XAI Concepts Made Simple
XAI terminology can seem intimidating, but these concepts are more accessible than they appear:
1. Feature Importance: What Factors Matter Most?
Feature importance answers: "Which input factors had the biggest impact on this decision?" If an AI denies a loan application, feature importance might show that credit score weighed 40%, debt-to-income ratio 30%, employment history 20%, and other factors 10%.
Think of it like a recipe's ingredients list with measurements. Flour might be the most important ingredient in bread, but salt, yeast, and water still play crucial roles. Feature importance quantifies these contributions.
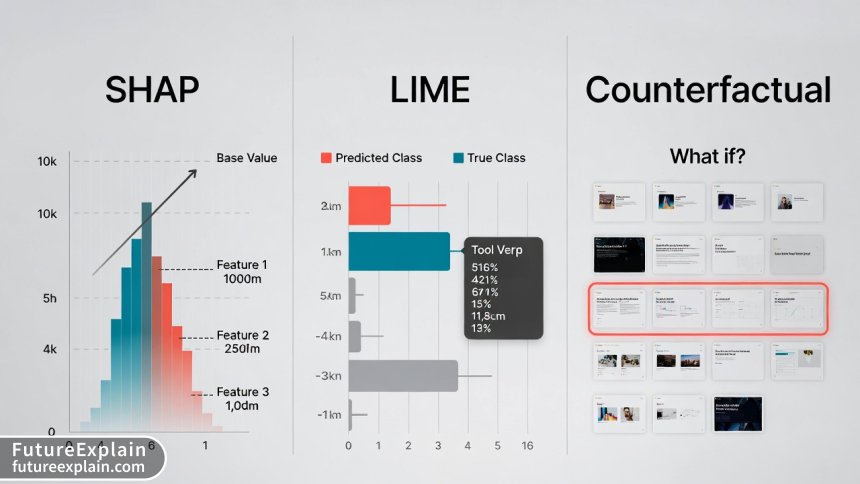
2. SHAP (SHapley Additive exPlanations): The "Fair Distribution" Method
SHAP comes from game theory and answers: "How much did each factor contribute compared to an average prediction?" It's like analyzing a basketball team's win: LeBron scored 30 points, but his overall contribution includes assists, defense, and leadership.
SHAP values have a mathematical elegance—they ensure fair credit distribution among features. The key insight: SHAP shows both magnitude (how much impact) and direction (increasing or decreasing the outcome probability).
3. LIME (Local Interpretable Model-agnostic Explanations): The "Simple Approximation" Method
LIME creates simple explanations for individual predictions. Imagine a complex modern art piece that's difficult to interpret. LIME is like a museum guide pointing to specific elements and saying: "This blue section creates melancholy, these sharp lines suggest tension."
LIME works by slightly modifying the input and observing how the prediction changes, building a simple model that approximates the complex one locally. It's particularly useful for explaining specific decisions rather than overall model behavior.
4. Counterfactual Explanations: The "What If" Scenarios
Counterfactuals answer: "What would need to change to get a different outcome?" If a loan was denied, counterfactual explanations might say: "If your credit score was 720 instead of 680, you would have been approved" or "If your debt-to-income ratio was below 35% instead of 42%, approval likelihood increases by 65%."
These are immensely practical because they provide actionable guidance rather than just explanations.
5. Model-Agnostic vs. Model-Specific Methods
Some XAI techniques work with any AI model (agnostic), while others are designed for specific model types. This distinction matters when choosing tools. Agnostics methods like LIME and SHAP are versatile but sometimes less precise; model-specific methods can provide deeper insights but only work with certain AI architectures.
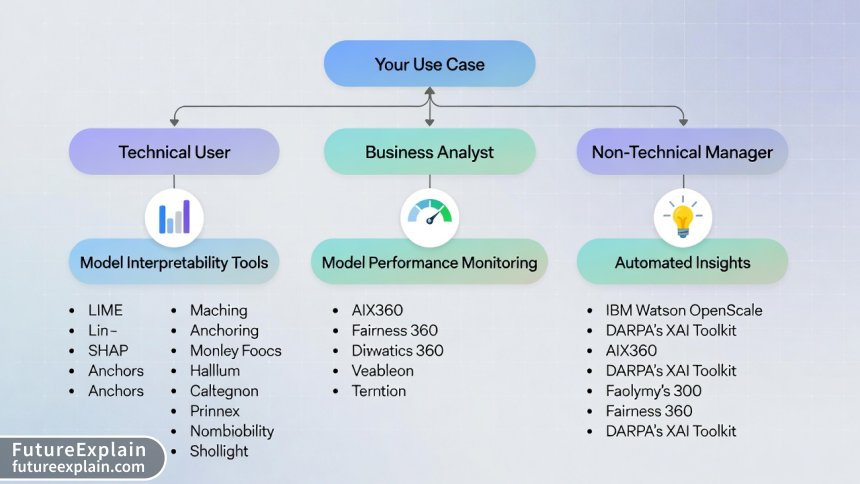
XAI Tool Categories: From No-Code to Developer Platforms
Now let's explore the practical tools available. We've categorized them by user expertise to help you find the right starting point:
Category 1: No-Code & Business User Tools
These platforms require no programming knowledge and offer visual interfaces for XAI:
- Arize AI: End-to-end ML observability platform with intuitive XAI features. Great for monitoring production models and explaining drift.
- Fiddler AI: Focuses on model performance monitoring and explainability with business-friendly dashboards.
- WhyLabs: Provides AI reliability platform with automatic explanations for data and model issues.
- DataRobot: AutoML platform with built-in explainability features accessible through point-and-click interface.
These tools typically work by connecting to your data sources or model endpoints, then providing visualization dashboards that business users can navigate. They abstract away the technical complexity while maintaining interpretability.
Category 2: Data Analyst & Citizen Data Scientist Tools
For users comfortable with data but not necessarily coding:
- Alteryx: Data science platform with visual workflow for model building and explainability.
- RapidMiner and KNIME: Visual programming tools with XAI extensions and plugins.
- Tableau Explain Data: Built-in AI explanation feature within the popular visualization tool.
- Microsoft Power BI: AI insights feature that automatically generates explanations for data patterns.
These platforms use visual programming paradigms—dragging and connecting nodes rather than writing code. They're ideal for business analysts who work regularly with data but lack formal data science training.
Category 3: Data Scientist & Developer Tools
Code-based libraries and frameworks for technical users:
- SHAP Python Library: The gold standard for model explanations with extensive visualization capabilities.
- LIME: Python library for local interpretable explanations.
- InterpretML: Microsoft's open-source package that unifies multiple XAI methods.
- Captum: PyTorch's model interpretability library.
- ELI5 (Explain Like I'm 5): Python library for debugging ML classifiers.
- DALEX (Descriptive mAchine Learning EXplanations): R and Python package for model-agnostic explanations.
These require programming knowledge but offer maximum flexibility and depth. Many include both code APIs and visualization components.
Category 4: Enterprise & Specialized Platforms
Comprehensive solutions for large organizations with specific needs:
- IBM Watson OpenScale: Enterprise-grade AI lifecycle platform with bias detection and explainability.
- Google Vertex AI Explanations: Integrated XAI within Google's ML platform.
- Amazon SageMaker Clarify: Bias detection and feature importance within AWS ecosystem.
- H2O.ai Driverless AI: AutoML with automatic reason codes and explanations.
These platforms often integrate with existing enterprise infrastructure and provide compliance-ready documentation features.
Step-by-Step: Using No-Code XAI Tools
Let's walk through a practical example using a hypothetical no-code XAI platform. We'll assume you're a business user trying to understand why your customer churn prediction model flags certain accounts as high-risk.
Step 1: Connect Your Data
Most no-code platforms offer multiple connection options: upload CSV/Excel files, connect to databases (SQL Server, PostgreSQL, etc.), or link to cloud storage (Google Drive, Dropbox, S3). For our example, we'll upload a CSV containing customer data and churn predictions.
Step 2: Select What to Explain
Choose the prediction you want explained. In our case: "Why did the model predict Customer #12345 has an 87% churn risk?" The platform might ask you to specify the model output column and the specific row (customer) to analyze.
Step 3: Choose Explanation Method
Select from available explanation types. Many platforms default to SHAP or LIME for individual predictions. Some offer "counterfactual" or "what-if" explanations as alternatives.
Step 4: Interpret the Results
The platform generates visual explanations. Common outputs include:
- Feature Importance Bar Chart: Shows which factors most influenced this prediction
- Waterfall Plot: Visualizes how each feature moved the prediction from baseline to final value
- Force Plot: Interactive visualization showing feature contributions
- Partial Dependence Plot: Shows relationship between a feature and prediction
Step 5: Take Action
Based on explanations, you might discover that high churn risk stems from: 1. 45-day gap since last purchase (contributes +32% to churn risk) 2. Negative customer service interaction last month (+28%) 3. Competitor price 15% lower for similar products (+18%)
This immediately suggests actionable interventions: reach out to customers approaching 45-day inactivity, review recent service complaints, or analyze competitor pricing.
Reading XAI Visualizations: A Practical Guide
XAI tools produce various visualizations that can seem confusing at first. Here's how to interpret the most common ones:
1. SHAP Summary Plots
These show overall feature importance across many predictions. Features are listed vertically (most important at top), with each dot representing one prediction. Dot color shows feature value (blue=low, red=high), horizontal position shows impact on prediction (left=decreases prediction, right=increases).
How to read: Look for clusters of red dots on the right or blue dots on the left—these indicate strong directional relationships. For example, if "days since last purchase" has red dots clustered on the right, it means higher values strongly increase churn prediction.
2. SHAP Waterfall Plots
These explain individual predictions. They start with a baseline (average prediction) and show how each feature moves the prediction up or down to reach the final value.
How to read: Follow the flow from left to right. Each bar shows a feature's contribution, with length indicating magnitude and direction (right=increases prediction, left=decreases). The final bar shows the prediction value. This is excellent for explaining specific cases to stakeholders.
3. LIME Feature Importance Bars
Simple bar charts showing which features were most important for a specific prediction, with weights indicating how much each feature contributed.
How to read: Longer bars = more important features. Positive weights push the prediction toward one class, negative weights toward the other. Simpler than SHAP but limited to local explanations.
4. Partial Dependence Plots (PDP)
Show how changing one feature affects predictions while averaging out other features. Usually line charts showing prediction probability on Y-axis and feature value on X-axis.
How to read: Look for trends and inflection points. A steadily rising line means higher feature values consistently increase prediction probability. A U-shaped curve suggests optimal values in the middle range. Flat lines indicate the feature has little impact.
5. Counterfactual Examples
Typically presented as "before/after" scenarios or lists of changes needed to alter the outcome.
How to read: Look for the smallest changes that would flip the prediction. The most actionable counterfactuals suggest feasible changes. If a loan denial counterfactual says "increase income by $500,000," that's not helpful. "Increase credit score by 40 points" might be achievable.
Real Business Case Studies: XAI in Action
Case Study 1: Retail Bank Loan Approvals
Challenge: A regional bank's AI loan approval system had 92% accuracy but faced regulatory scrutiny and customer complaints about unexplained rejections.
XAI Implementation: Integrated SHAP explanations into their decision pipeline. Every rejection now includes a "Key Factors" report showing the top 3 reasons with quantitative impact.
Results: Customer dispute calls decreased by 67%. Regulators approved the enhanced system. The bank discovered their model was improperly weighing ZIP code data (potential proxy for race), which they corrected.
Tool Used: Fiddler AI with custom SHAP integration
Case Study 2: E-commerce Product Recommendations
Challenge: An online retailer's recommendation engine suggested irrelevant products, but the data science team couldn't determine why certain recommendations were generated.
XAI Implementation: Used LIME to explain individual recommendations, revealing that temporary inventory issues were causing the model to overweight less relevant factors.
Results: Identified and fixed data pipeline issues. Improved recommendation relevance by 34% measured through click-through rates. Created "explain this recommendation" feature that increased customer trust.
Tool Used: Arize AI with LIME explanations
Case Study 3: Healthcare Diagnostic Support
Challenge: A hospital's AI system for pneumonia detection from X-rays showed high accuracy but radiologists hesitated to trust it without understanding its reasoning.
XAI Implementation: Integrated Grad-CAM visualizations showing which image regions most influenced the prediction (heatmap overlays on X-rays).
Results: Radiologist adoption increased from 23% to 89%. Discovered the model was sometimes focusing on hospital equipment markers rather than lung tissue—a critical error that was corrected.
Tool Used: Captum with custom medical imaging integration
Choosing the Right XAI Tools: Decision Framework
With so many options, how do you choose? Use this decision framework:
Step 1: Assess Your Needs
- Audience: Who needs explanations? Technical teams, business users, customers, regulators?
- Use Case: Model debugging, regulatory compliance, stakeholder communication, bias detection?
- Technical Constraints: On-premise vs cloud, integration requirements, budget?
- Model Types: What AI models need explaining? Traditional ML, deep learning, ensembles?
Step 2: Match Tools to Requirements
We've created this quick-reference table based on extensive tool evaluation:
| Tool | Best For | Skill Level | Cost | Key Feature | Limitation |
|---|---|---|---|---|---|
| Arize AI | Production monitoring | Business users | $$$ | End-to-end observability | Higher cost for small teams |
| Fiddler AI | Enterprise compliance | Business users | $$$$ | Advanced bias detection | Steep learning curve |
| SHAP Library | Technical deep dives | Data scientists | Free | Most comprehensive | Requires coding |
| LIME | Local explanations | Data scientists | Free | Simple to implement | Less stable than SHAP |
| InterpretML | Unified framework | Data scientists | Free | Multiple methods in one | Less visualization |
| DataRobot | End-to-end AutoML | Citizen data scientists | $$$$ | Integrated workflow | Vendor lock-in |
| WhyLabs | Data quality monitoring | Data engineers | $$ | Automatic alerts | Limited model types |
| Tableau Explain Data | BI integration | Business analysts | Included | No additional cost | Basic explanations only |
Step 3: Consider Implementation Factors
- Integration Complexity: How easily does it connect to your existing systems?
- Scalability: Can it handle your data volume and prediction frequency?
- Support & Community: Is there adequate documentation and user support?
- Future Roadmap: Is the tool actively developed with planned enhancements?
Common XAI Pitfalls and How to Avoid Them
Even with good tools, XAI implementations can fail. Here are common mistakes and solutions:
Pitfall 1: Treating Explanations as Ground Truth
Problem: Assuming XAI outputs are perfect explanations rather than approximations.
Solution: Use multiple explanation methods and look for consensus. Treat explanations as hypotheses to test, not final answers.
Pitfall 2: Ignoring Feature Correlations
Problem: Many XAI methods struggle with highly correlated features, potentially misattributing importance.
Solution: Check feature correlations before interpretation. Consider techniques designed for correlated features or use dimensionality reduction.
Pitfall 3: Overwhelming Stakeholders
Problem: Presenting technical XAI outputs to non-technical audiences causes confusion.
Solution: Create simplified summaries focused on actionable insights. Use the "Explain Like I'm a Manager" approach: 3 key factors, directional impact, and business implications.
Pitfall 4: Performance Overhead
Problem: Some XAI methods significantly slow down prediction systems.
Solution: For real-time systems, consider approximate methods or compute explanations asynchronously. Cache common explanations when possible.
Pitfall 5: False Sense of Security
Problem: Believing XAI automatically ensures ethical, unbiased AI.
Solution: XAI reveals what the model does, not what it should do. Combine with bias detection tools, human oversight, and ethical review processes.
Creating Effective XAI Reports for Stakeholders
Communicating XAI findings effectively is as important as generating them. Here's a template for stakeholder reports:
1. Executive Summary (1 paragraph)
Briefly state what was analyzed, key findings, and business implications.
2. Model Performance Context
Place explanations within overall model performance: accuracy, precision, recall, and any performance disparities across subgroups.
3. Top Factors Influencing Decisions
List the 3-5 most important factors with simple descriptions of their impact. Use visualizations sparingly—choose one clear chart.
4. Representative Case Examples
Include 2-3 specific examples with before/after scenarios or what-if analyses that illustrate typical patterns.
5. Potential Issues Identified
Highlight any concerning patterns: potential biases, data quality issues, or unexpected factor weightings.
6. Recommended Actions
Specific, actionable recommendations: model adjustments, data collection improvements, process changes, or further investigations needed.
7. Limitations & Next Steps
Honestly state what the analysis can't determine and propose follow-up work.
This structure balances technical depth with accessibility, making XAI insights actionable for decision-makers.
The Future of XAI: Emerging Trends
XAI is rapidly evolving. Here's what to expect in the coming years:
1. Automated Explanation Generation
AI systems that not only provide explanations but also tailor them to the audience's expertise level automatically.
2. Causal XAI
Moving beyond correlations to identify causal relationships—understanding not just what factors are associated with outcomes, but which actually cause them.
3. Interactive Explanations
Real-time "what-if" interfaces allowing users to explore how changes would affect predictions, building intuition through experimentation.
4. Standardized XAI Metrics
Quantitative measures of explanation quality, enabling objective comparison of different XAI methods.
5. Regulatory-Driven Development
As AI regulations solidify worldwide (EU AI Act, US AI frameworks), compliance requirements will drive XAI tool development toward specific standards.
6. Integrated Development Environments
XAI features becoming standard components of AI development platforms rather than separate tools.
Getting Started: Your XAI Action Plan
Ready to implement XAI? Follow this 30-day action plan:
Week 1: Assessment & Education
- Inventory your AI systems and prioritize which need explainability first
- Identify key stakeholders and their explanation needs
- Complete one beginner XAI tutorial (we recommend Google's "Explainable AI" course)
Week 2: Tool Evaluation
- Test 2-3 tools from our recommended list using your own data or public datasets
- Evaluate based on your specific requirements from the decision framework
- Document pros/cons of each option
Week 3: Pilot Implementation
- Select one high-impact, lower-risk model for XAI pilot
- Implement explanations using chosen tool
- Create initial stakeholder report using our template
Week 4: Evaluation & Scaling
- Gather feedback from stakeholders on pilot explanations
- Refine approach based on lessons learned
- Develop roadmap for scaling XAI to additional models
Conclusion: XAI as Essential Infrastructure
Explainable AI has transitioned from academic curiosity to business necessity. As AI systems make increasingly important decisions, the ability to understand, trust, and improve these systems becomes critical to ethical operation, regulatory compliance, and business value.
The good news: you don't need a PhD in machine learning to benefit from XAI. Today's tools offer accessible pathways for business users, analysts, and managers to gain insights into AI decision-making. By starting with clear use cases, choosing appropriate tools for your skill level and needs, and focusing on actionable insights, you can implement XAI effectively in your organization.
Remember that XAI is a journey, not a destination. Start small, learn iteratively, and expand as you build confidence and demonstrate value. The transparency you build today will become competitive advantage tomorrow as AI accountability becomes the norm rather than the exception.
Visuals Produced by AI
Further Reading
Share
What's Your Reaction?
 Like
16483
Like
16483
 Dislike
47
Dislike
47
 Love
1256
Love
1256
 Funny
389
Funny
389
 Angry
23
Angry
23
 Sad
15
Sad
15
 Wow
729
Wow
729


One year from now, I predict XAI will be as standard as version control is for software. This article is ahead of the curve.
What's the simplest XAI tool for a small business with one data scientist? We can't afford enterprise platforms.
Oliver, start with SHAP library (free) or Google's What-If Tool (also free). Both have learning curves but are powerful. If you need simpler, consider WhyLabs' starter plan or the open-source Evidently AI.
Final ROI calculation: XAI implementation cost $85k, saved $220k in potential regulatory fines, plus undetermined savings from better model decisions. Worth it.
The article underemphasizes the organizational change aspect. Implementing XAI requires cultural shift, not just technical tools.
Matthew, absolutely. We had to train not just data scientists but also product managers, legal team, and even customer support on interpreting explanations. Change management was 60% of the effort.
Month-end update: Completed the 30-day plan. XAI is now integrated into our ML workflow. Next challenge: scaling to all 47 production models.
We're now requiring XAI reports for all model deployments. The quality of our AI systems has improved dramatically as teams know their decisions will be examined.